Space Strategic Intelligence
An interactive map of the two space blocs, their capabilities, and the legal walls between them
A self-contained interactive briefing that turns a fragmented geopolitical dataset into a navigable view of global space capability and alignment.
01 — The business problem
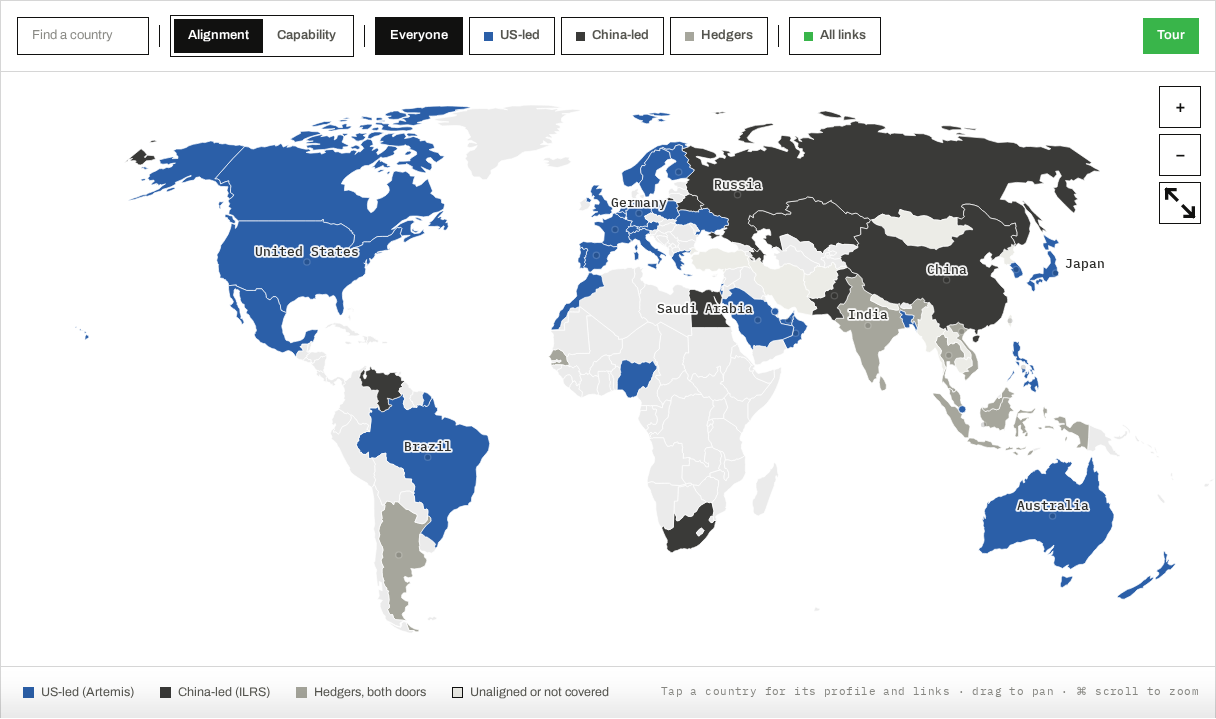
Space is no longer a single global commons. Two rival frameworks now run in parallel: the US-led Artemis Accords and the China-led International Lunar Research Station. Decision-makers in aerospace, defence, investment and policy need to see who sits where, what each side can actually do, and where cooperation is legally impossible. The information is public but scattered across treaties, launch records, news reports and analyst notes. There is no single view that makes the landscape explorable in one sitting.
02 — The workflow
- A world map gives the first answer at a glance: US-aligned, China-aligned, hedging, or unaligned.
- Layer controls let the reader switch between alignment, capability and legal-barrier views without leaving the page.
- Clicking any country opens a profile that explains its position, its space programme, and its recent moves.
- A guided tour walks a non-expert through the four forces that keep the two camps apart, so the page works as a briefing as well as a reference tool.
03 — What I built
- A standalone HTML page with an inline SVG world map, custom interaction layer, and responsive bento-grid editorial layout.
- Segmented controls for alignment, capability and legal-barrier views.
- Country search and clickable profiles with sourced recent events.
- Guided narrative tour for readers who need context, not just data.
- No login, no build step for the reader. It loads as a normal web page and works immediately.
04 — Tools used
HTML + CSS + vanilla JavaScript · Inline SVG map · Google Fonts (Archivo + IBM Plex Mono) · Schema.org structured data
05 — Commercial use case
A reusable pattern for strategic intelligence briefings: a dense domain rendered as a navigable interactive page. The same approach applies to defence, energy, supply-chain and regulatory landscapes where decision-makers need to see relationships and constraints in one view instead of reading ten documents.
06 — ROI and adoption
A landscape that used to take a day of reading now fits in one scrollable briefing.
Illustrative assumptions
- Baseline: a policy or investment team spends 4 to 8 hours assembling a current view of a geopolitical landscape from scattered sources.
- A well-built interactive briefing collapses that to a 5-minute orientation, with sources and country profiles linked directly.
- The value is clarity and shareability: a single URL that aligns a team before the deeper work begins.